This post installs Grafana Alloy on Kubernetes as a push-only OpenTelemetry gateway and exposes:
- Alloy UI:
https://alloy.maksonlee.com/ - OTLP/HTTP ingest (push metrics/logs/traces):
https://alloy.maksonlee.com/v1/traceshttps://alloy.maksonlee.com/v1/metricshttps://alloy.maksonlee.com/v1/logs
We keep OTLP/gRPC (4317) enabled inside the cluster (ClusterIP only), but not exposed externally.
This post is based on
Lab context
- Kubernetes namespace:
observability - Ingress controller: Traefik
- MetalLB: Traefik LoadBalancer IP (example:
192.168.0.98) - Wildcard TLS already configured as Traefik default certificate:
*.maksonlee.com
- Existing LGTM services (already deployed):
- Mimir gateway:
lgtm-mimir-gateway - Loki gateway:
lgtm-loki-gateway - Tempo:
lgtm-tempo
- Mimir gateway:
Why Alloy (push-only)
If you want a push model, your apps need an OTLP receiver to send telemetry to.
Alloy provides:
- OTLP receiver:
- 4318 OTLP/HTTP (works well behind Traefik HTTPS)
- 4317 OTLP/gRPC (kept internal-only)
- Pipelines to forward data to:
- Mimir (metrics)
- Loki (logs)
- Tempo (traces)
Push-only means “apps push into Alloy” (no Prometheus scrape / no ServiceMonitor).
Tenant headers note (homelab single-tenant)
In my previous Mimir/Loki posts, I run both backends in single-tenant mode (multitenancy_enabled: false). That means clients (including Alloy) do not need to send X-Scope-OrgID / tenant_id.
If your Mimir/Loki is multi-tenant, you must set a tenant (for example X-Scope-OrgID) when pushing metrics/logs.
What you’ll get
- Alloy running in
observabilitywith:- UI + health:
12345 - OTLP/gRPC:
4317(internal only) - OTLP/HTTP:
4318(exposed via Traefik)
- UI + health:
- Add the Grafana Helm repo
helm repo add grafana https://grafana.github.io/helm-charts
helm repo update
- Create
alloy-values.yaml
mkdir -p ~/lgtm
cd ~/lgtm
vi alloy-values.yaml
Paste:
# alloy-values.yaml
# Push-only OTLP gateway: OTLP in (4317/4318) -> Mimir/Loki/Tempo out

controller:
  type: deployment
  replicas: 1

service:
  enabled: true
  type: ClusterIP

alloy:
  # Alloy HTTP server (UI + health)
  listenPort: 12345

  # Expose OTLP receiver ports on the Pod/Service (ClusterIP only)
  extraPorts:
    - name: otlpgrpc
      port: 4317
      targetPort: 4317
      protocol: TCP
    - name: otlphttp
      port: 4318
      targetPort: 4318
      protocol: TCP

  configMap:
    create: true
    content: |-
      logging {
        level  = "info"
        format = "logfmt"
      }

      otelcol.receiver.otlp "ingest" {
        grpc {
          endpoint = "0.0.0.0:4317"
        }
        http {
          endpoint = "0.0.0.0:4318"
        }

        output {
          metrics = [otelcol.processor.batch.default.input]
          logs    = [otelcol.processor.batch.default.input]
          traces  = [otelcol.processor.batch.default.input]
        }
      }

      otelcol.processor.batch "default" {
        output {
          metrics = [otelcol.exporter.prometheus.default.input]
          logs    = [otelcol.exporter.loki.default.input]
          traces  = [otelcol.exporter.otlp.tempo.input]
        }
      }

      // Metrics -> Mimir (Prometheus remote_write)
      otelcol.exporter.prometheus "default" {
        forward_to = [prometheus.remote_write.mimir.receiver]
      }

      prometheus.remote_write "mimir" {
        endpoint {
          url = "http://lgtm-mimir-gateway.observability.svc.cluster.local/api/v1/push"
        }
      }

      // Logs -> Loki (push API)
      otelcol.exporter.loki "default" {
        forward_to = [loki.write.loki.receiver]
        resource_to_telemetry_conversion = true
      }

      loki.write "loki" {
        endpoint {
          url = "http://lgtm-loki-gateway.observability.svc.cluster.local/loki/api/v1/push"
        }
      }

      // Traces -> Tempo (OTLP gRPC inside cluster)
      otelcol.exporter.otlp "tempo" {
        client {
          endpoint = "lgtm-tempo.observability.svc.cluster.local:4317"
          tls {
            insecure = true
          }
        }
      }
- Install Alloy
helm upgrade --install lgtm-alloy grafana/alloy \
  -n observability \
  -f alloy-values.yaml
Verify:
kubectl -n observability get pods | grep alloy
kubectl -n observability get svc lgtm-alloy
kubectl -n observability logs deploy/lgtm-alloy -c alloy --tail=80
- Create the Ingress to expose UI + OTLP/HTTP
Create alloy-ingress.yaml:
vi alloy-ingress.yaml
Paste:
apiVersion: networking.k8s.io/v1
kind: Ingress
metadata:
  name: lgtm-alloy
  namespace: observability
spec:
  ingressClassName: traefik
  rules:
  - host: alloy.maksonlee.com
    http:
      paths:
      - path: /v1
        pathType: Prefix
        backend:
          service:
            name: lgtm-alloy
            port:
              number: 4318
      - path: /
        pathType: Prefix
        backend:
          service:
            name: lgtm-alloy
            port:
              number: 12345
Apply:
kubectl apply -f alloy-ingress.yaml
kubectl -n observability get ingress lgtm-alloy
HTTPS note (using Traefik default wildcard cert)
In my earlier Traefik HTTPS post, Traefik is configured with a default TLSStore using *.maksonlee.com and a global HTTP→HTTPS redirect. Because of that, this Ingress does not include a per-app tls: section (and still serves HTTPS successfully).
If your Traefik is not configured this way, add a tls: block (per-host Secret) or enable TLS via Traefik annotations.
- Verify Alloy UI
curl -I https://alloy.maksonlee.com/-/ready
You want HTTP/2 200.
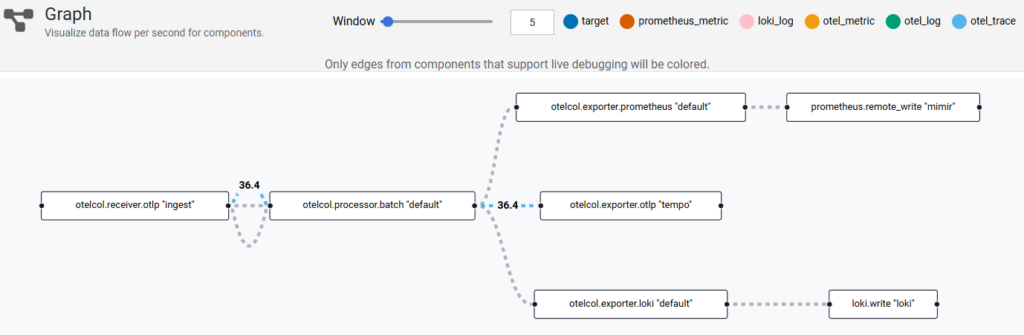
Verify pipelines in Alloy UI (Graph)
Open https://alloy.maksonlee.com/graph
You should see the OTLP receiver feeding the batch processor, then exporting to:
- Prometheus remote_write → Mimir (
prometheus.remote_write "mimir") - Loki push → Loki (
loki.write "loki") - OTLP exporter → Tempo (
otelcol.exporter.otlp "tempo")
- Verify OTLP/HTTP routing
This uses an empty protobuf body, so success isn’t expected. The goal is that the request reaches Alloy via Traefik.
curl -vk -X POST https://alloy.maksonlee.com/v1/traces \
  -H 'Content-Type: application/x-protobuf' \
  --data-binary ''
- Configure apps to push telemetry (OTLP/HTTP)
export OTEL_EXPORTER_OTLP_PROTOCOL=http/protobuf
export OTEL_EXPORTER_OTLP_ENDPOINT=https://alloy.maksonlee.com
Or per-signal endpoints:
export OTEL_EXPORTER_OTLP_TRACES_ENDPOINT=https://alloy.maksonlee.com/v1/traces
export OTEL_EXPORTER_OTLP_METRICS_ENDPOINT=https://alloy.maksonlee.com/v1/metrics
export OTEL_EXPORTER_OTLP_LOGS_ENDPOINT=https://alloy.maksonlee.com/v1/logs
export OTEL_EXPORTER_OTLP_PROTOCOL=http/protobuf
Did this guide save you time?
Support this site