
This post shows how to send FastAPI request metrics to Zabbix 8.0 APM with OpenTelemetry zero-code instrumentation and watch each API (HTTP method + route) on a template dashboard: requests, errors, mean and slowest response time. There’s no code change, and new APIs appear by themselves.
This post is based on
Lab context
- Zabbix:
zabbix.maksonlee.com, OTLP receiver on192.168.0.85:4317 - FastAPI host (example)
- OS: Ubuntu 26.04, Python
3.14.4 - App:
/opt/demo-api(venv, FastAPI0.141.1, Uvicorn0.52.0) - Unit:
demo-api.service
- OS: Ubuntu 26.04, Python
- OpenTelemetry: SDK
1.45.2, FastAPI instrumentation0.66b2 - Flow: FastAPI → Zabbix proxy → ClickHouse → Zabbix server → dashboard
What you’ll build
- The app started via
opentelemetry-instrument, exporting metrics only, every 60 seconds - One Zabbix host per app, with service totals and five items per API (discovered)
- The template’s HTTP host dashboard (Overview + API pages) and three triggers (5xx, 429, app not reporting)
Prerequisites
- The receiver and APM data source from the previous post.
- Python 3.10+ and a systemd unit for the app.
- The template (version
1.3.2): download zabbix-fastapi-apm-1.3.2.zip and extracthttp-route-mean.jsonon your computer.
1. Install the OpenTelemetry packages
On the FastAPI host, as the account that owns the venv:
/opt/demo-api/.venv/bin/python -m pip install \
  opentelemetry-api==1.45.2 opentelemetry-sdk==1.45.2 \
  opentelemetry-exporter-otlp-proto-grpc==1.45.2 \
opentelemetry-instrumentation-fastapi==0.66b2 opentelemetry-distro==0.66b2Expected (last line, shortened):
Successfully installed asgiref-3.13.0 googleapis-common-protos-1.76.0 grpcio-1.85.1 opentelemetry-api-1.45.2 opentelemetry-distro-0.66b2 …2. Create the OpenTelemetry settings
Create /etc/default/demo-api-otel:
sudo tee /etc/default/demo-api-otel >/dev/null <<'EOF'
OTEL_SERVICE_NAME=my-fastapi
OTEL_TRACES_EXPORTER=none
OTEL_TRACES_SAMPLER=always_off
OTEL_LOGS_EXPORTER=none
OTEL_METRICS_EXPORTER=otlp
OTEL_SEMCONV_STABILITY_OPT_IN=http
OTEL_EXPORTER_OTLP_METRICS_PROTOCOL=grpc
OTEL_EXPORTER_OTLP_METRICS_ENDPOINT=http://192.168.0.85:4317
OTEL_EXPORTER_OTLP_METRICS_INSECURE=true
OTEL_EXPORTER_OTLP_METRICS_TEMPORALITY_PREFERENCE=DELTA
OTEL_METRIC_EXPORT_INTERVAL=60000
EOFOTEL_SERVICE_NAME: one name per application (e.g.,my-fastapi); Zabbix selects the app by it.OTEL_SEMCONV_STABILITY_OPT_IN=http: emitshttp.server.request.durationin seconds.DELTAevery 60 seconds: what the template expects. Traces and logs stay off.
3. Start the app through opentelemetry-instrument
We add a drop-in that loads the file and puts opentelemetry-instrument in front of the existing start command:
sudo systemctl edit --stdin demo-api.service <<'EOF'
[Service]
EnvironmentFile=/etc/default/demo-api-otel
ExecStart=
ExecStart=/opt/demo-api/.venv/bin/opentelemetry-instrument /opt/demo-api/.venv/bin/uvicorn main:app --host 0.0.0.0 --port 8000
EOFExpected:
Successfully installed edited file '/etc/systemd/system/demo-api.service.d/override.conf'.The empty ExecStart= clears the old command. Keep your full command after opentelemetry-instrument.
Restart and check:
sudo systemctl restart demo-api.service
systemctl status demo-api.service --no-pager --lines=3Expected (example, key lines):
     Active: active (running) since Tue 2026-11-17 14:30:17 CST; 6ms ago
└─2726 /opt/demo-api/.venv/bin/python /opt/demo-api/.venv/bin/opentelemetry-instrument /opt/demo-api/.venv/bin/uvicorn main:app --host 0.0.0.0 --p…Note: uvicorn --workers 2 and Gunicorn + uvicorn_worker.UvicornWorker both delivered every request here (360 of 360). OpenTelemetry lists multi-worker metrics as unsupported, so check your own counts.
4. Confirm the metrics arrive
Send a request, then wait one minute for the first export:
curl -s -o /dev/null -w '%{http_code}\n' http://127.0.0.1:8000/api/itemsExpected:
200On zabbix, query ClickHouse with the default password:
clickhouse-client --host 127.0.0.1 --user default --ask-password --query "
  SELECT ServiceName, MetricName, MetricUnit, sum(Count) AS requests
  FROM otel.otel_metrics_histogram
GROUP BY ALL ORDER BY ALL"Expected (example):
my-fastapi	http.server.request.body.size	By	8
my-fastapi	http.server.request.duration	s	73
my-fastapi http.server.response.body.size By 73Or check in the frontend:
- APM → Metrics → open Filter
- Metric name:
http.server.request.duration, Type: Histogram - Service name:
my-fastapi→ Apply
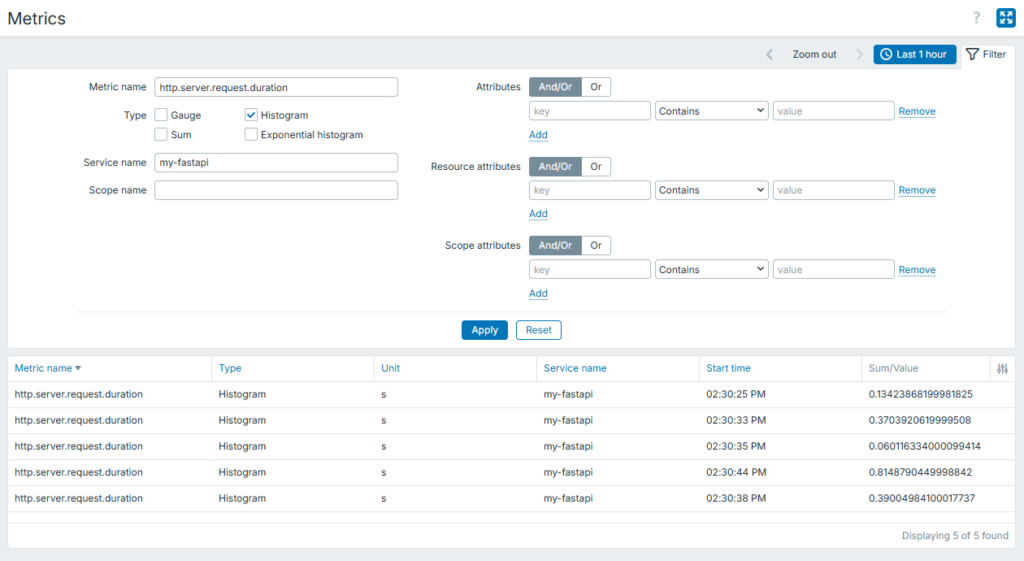
Still empty after two minutes? Look for Failed to export metrics in the app’s journal.
5. Import the template
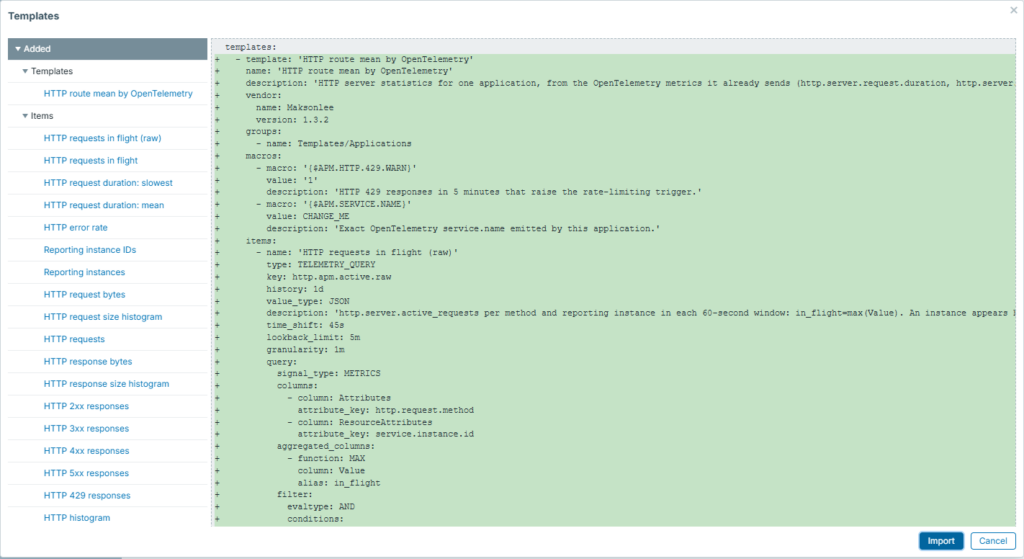
- Data collection → Templates → Import
- Choose
http-route-mean.json→ Import - Review the Added list → Import again
- You should see
Imported successfully.
6. Create the host
- Data collection → Hosts → Create host
- Host name:
my-fastapi - Templates:
HTTP route mean by OpenTelemetry - Host groups:
Applications
- Host name:
- Macros tab → Inherited and host macros
- On
{$APM.SERVICE.NAME}click Change and enter yourOTEL_SERVICE_NAME - Leave
{$APM.HTTP.429.WARN}at1
- On
- Click Add
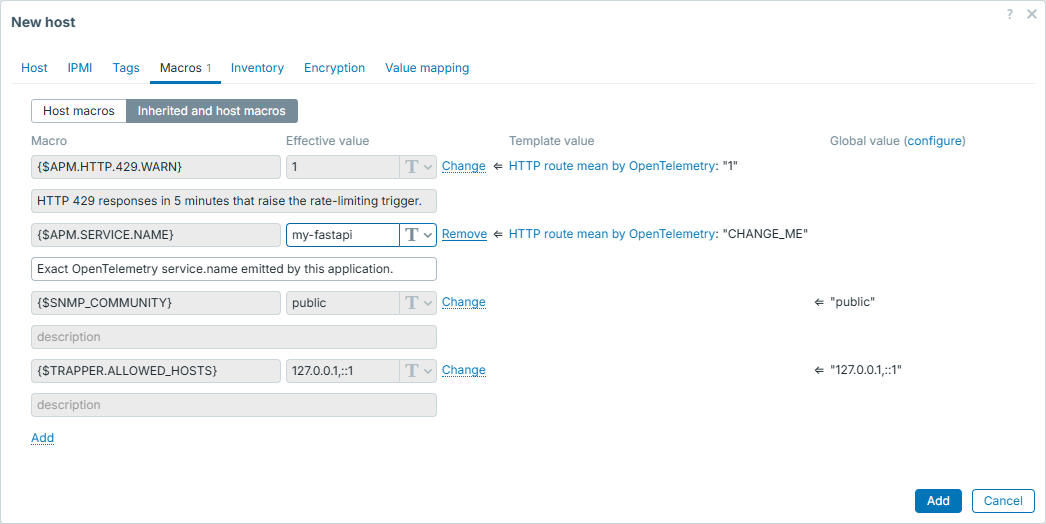
The host needs no agent: Zabbix server queries ClickHouse once a minute.
7. Open the dashboard
- Monitoring → Hosts → in the
my-fastapirow, click Dashboards (a host dashboard; the Dashboards menu doesn’t list it) - Overview: requests, error rate, 5xx, 429, mean and slowest request, busiest and slowest APIs
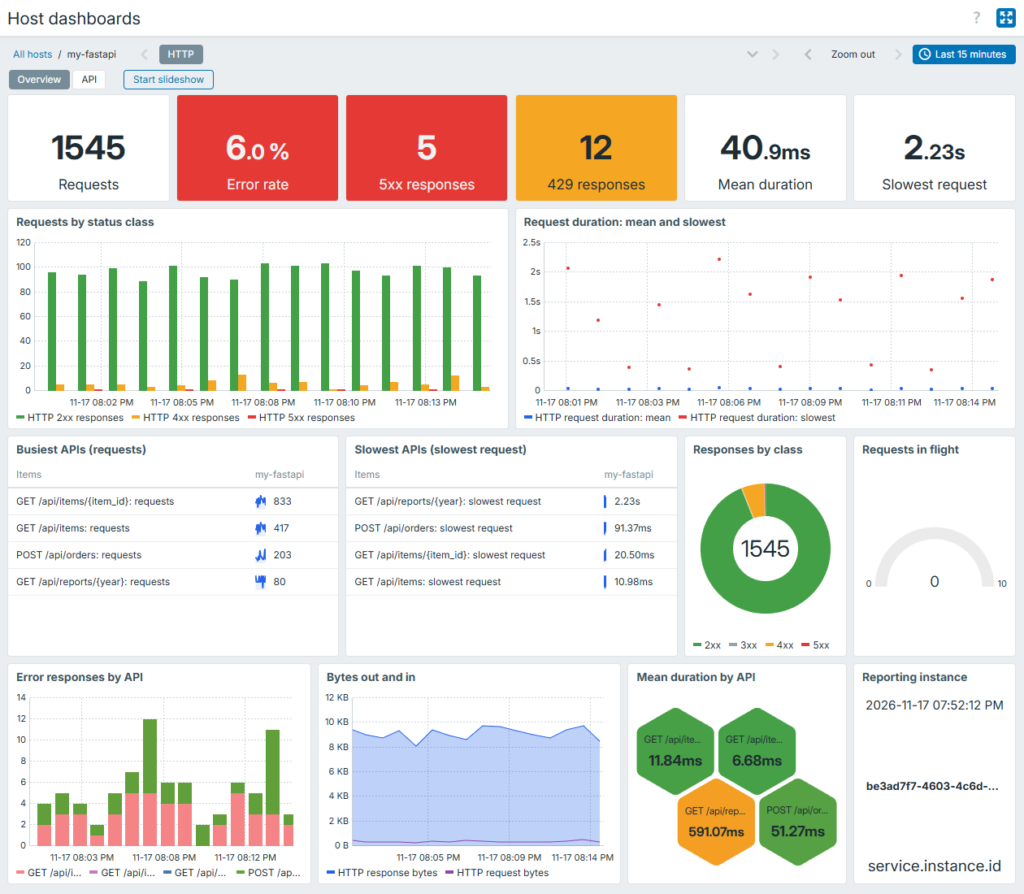
- API → in APIs, open a method and a route, then pick an item for its value and graph
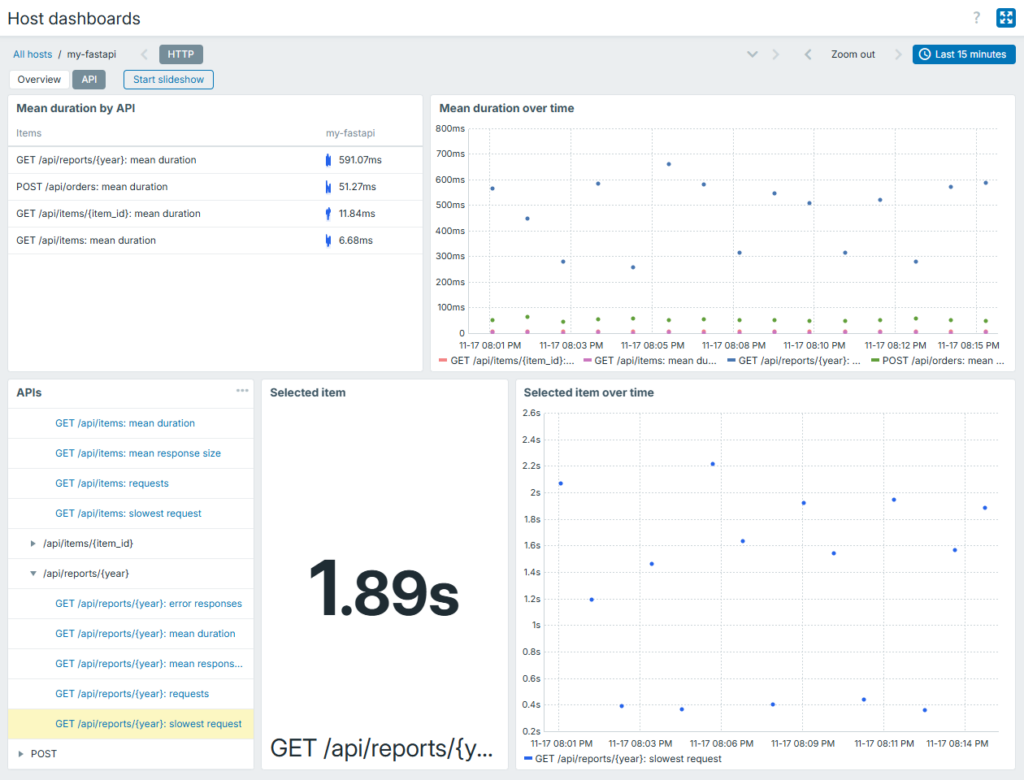
How to read it:
- Mean is total duration ÷ requests of one minute; slowest is the longest single request. Neither is a percentile.
- Counts are 0 in a quiet minute. Mean and slowest keep their last value. That isn’t zero.
- A new API appears about 2 minutes after its first request and gets a value after the next one.
8. Known behavior
- After a failed query, the next one catches up up to 5 minutes. Longer gaps are lost.
Summary
You now have requests, errors, and mean and slowest response time per API of a FastAPI app in Zabbix 8.0, from OpenTelemetry metrics only and with no code changes.