This post shows how to deploy the official Zabbix Kubernetes Helm chart into your cluster, run a Zabbix Proxy inside Kubernetes, enable kube-state-metrics, and then connect it to your external Zabbix Server (zabbix.maksonlee.com:10051).
Target setup:
- Namespace:
monitoring - Zabbix Proxy in-cluster (SQLite + PVC)
- Zabbix Agent DaemonSet on all nodes
- kube-state-metrics enabled
- Zabbix UI uses official HTTP templates:
- Kubernetes cluster state by HTTP
- Kubernetes nodes by HTTP
This post is based on the following posts:
- Prerequisites
- A working Kubernetes cluster and
kubectlaccess - Helm v3 installed (
helm version) - A default StorageClass (or you will explicitly set
storageClassNamefor the proxy PVC) - A reachable Zabbix Server:
zabbix.maksonlee.com:10051
- Create a namespace
kubectl create namespace monitoring --dry-run=client -o yaml | kubectl apply -f -- Clone the official Zabbix Kubernetes Helm chart
Clone and checkout the 7.4 branch:
mkdir -p ~/zabbix
cd ~/zabbix

git clone https://git.zabbix.com/scm/zt/kubernetes-helm.git
cd kubernetes-helm

git checkout release/7.4- Create the proxy PVC
If the chart is configured to use persistent storage for the proxy SQLite database, the proxy pod will mount a PVC named:
zabbix-zabbix-helm-chart-proxy
If it does not exist, scheduling fails with an event similar to:
persistentvolumeclaim “zabbix-zabbix-helm-chart-proxy” not found
Create it:
kubectl -n monitoring apply -f - <<'EOF'
apiVersion: v1
kind: PersistentVolumeClaim
metadata:
  name: zabbix-zabbix-helm-chart-proxy
spec:
  accessModes:
    - ReadWriteOnce
  resources:
    requests:
      storage: 2Gi
  # storageClassName: "<YOUR_STORAGECLASS>"
EOFVerify:
kubectl -n monitoring get pvc- Create Helm values
Create ~/zabbix/zabbix-values.yaml:
cat > ~/zabbix/zabbix-values.yaml <<'EOF'
zabbixProxy:
  enabled: true
  persistentVolume:
    enabled: true
    size: 2Gi
  containerSecurityContext:
    runAsUser: 0
    runAsGroup: 0
  env:
    - name: ZBX_PROXYMODE
      value: "0"
    - name: ZBX_HOSTNAME
      value: "kubernetes-proxy"
    - name: ZBX_SERVER_HOST
      value: "zabbix.maksonlee.com:10051"

kubeStateMetrics:
  enabled: true

zabbixAgent:
  enabled: true
EOFNotes:
ZBX_PROXYMODE=0means active proxy (proxy connects to the server)ZBX_HOSTNAMEmust match the proxy name created in the Zabbix UIkubeStateMetricsenables metrics used by “cluster state” templatezabbixAgentdeploys an agent to each node (DaemonSet)
- Install the chart
From the repo directory:
cd ~/zabbix/kubernetes-helm

helm install zabbix . \
  --dependency-update \
  -n monitoring \
-f ~/zabbix/zabbix-values.yamlCheck resources:
kubectl -n monitoring get pods -o wide
kubectl -n monitoring get svc
kubectl -n monitoring get ep
kubectl -n monitoring get saExpected pods (names vary slightly by chart version):
zabbix-zabbix-helm-chart-proxy-*zabbix-zabbix-helm-chart-agent-*zabbix-kube-state-metrics-*
If the proxy pod is stuck Pending, inspect it:
kubectl -n monitoring describe pod <proxy-pod-name>- Verify proxy → server connectivity from inside the pod
Select a proxy pod and test DNS + TCP connectivity to the Zabbix server port:
PROXY_POD=$(kubectl -n monitoring get pods -o name | grep zabbix-zabbix-helm-chart-proxy | head -n1 | cut -d/ -f2)

kubectl -n monitoring exec -it "$PROXY_POD" -- sh -lc \
'getent hosts zabbix.maksonlee.com && nc -vz zabbix.maksonlee.com 10051'Check proxy logs:
kubectl -n monitoring logs "$PROXY_POD" --tail=200Look for:
- “Starting Zabbix Proxy (active)”
- “received configuration data from server …”
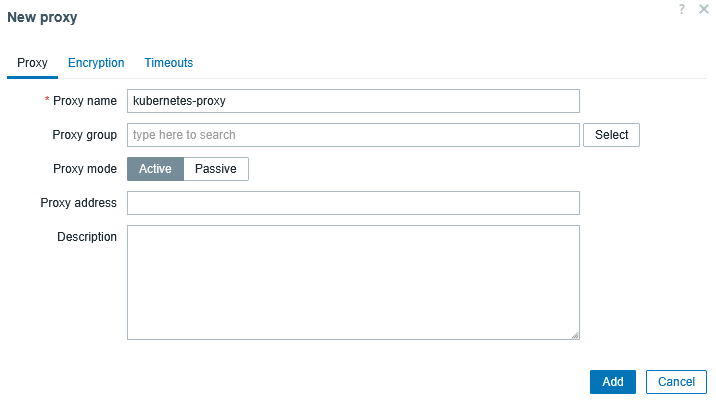
- Zabbix UI: create the proxy
Go to:
Administration → Proxies → Create proxy
- Proxy name:
kubernetes-proxy - Proxy mode: Active
Save.
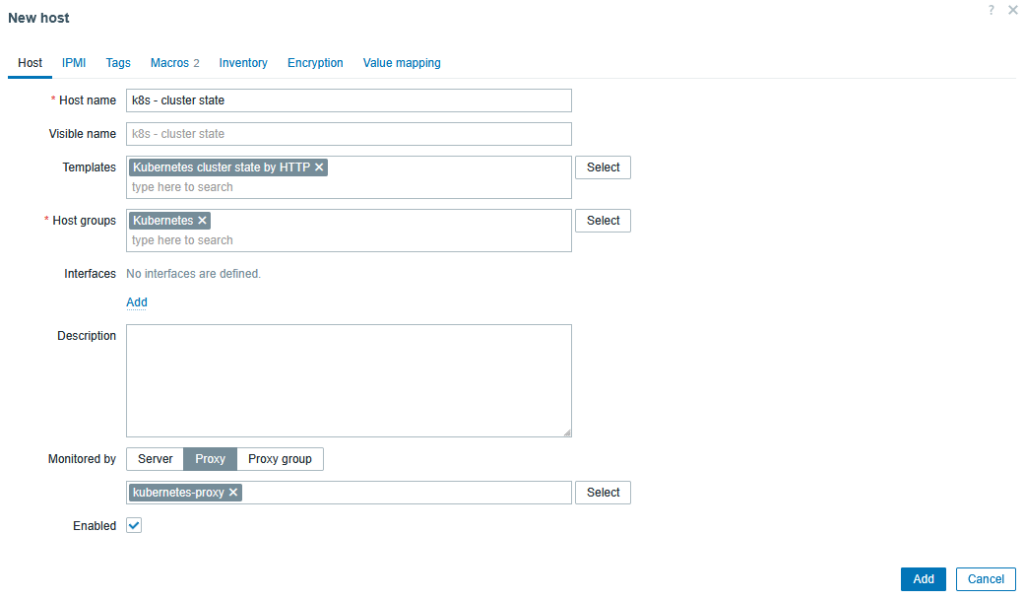
- Zabbix UI: create Host A (Cluster state)
Go to:
Data collection → Hosts → Create host
- Host name:
k8s - cluster state - Host groups: e.g.
Kubernetes - Monitored by: Proxy →
kubernetes-proxy - Templates:
Kubernetes cluster state by HTTP - Interfaces: none required (HTTP/script items)
Save.
Configure required macros (Host macros)
Go to:
Data collection → Hosts → k8s – cluster state → Macros
Set at minimum:
- {$KUBE.API.URL}
Default value is usually:
https://kubernetes.default.svc.cluster.local:443
- {$KUBE.API.TOKEN}
Get a ServiceAccount token and paste it here.
If a secret token exists:
kubectl get secret zabbix-zabbix-helm-chart -n monitoring -o jsonpath={.data.token} | base64 -dIf your cluster does not create token secrets automatically, create a token via TokenRequest:
kubectl -n monitoring create token zabbix-zabbix-helm-chartPaste the output into {$KUBE.API.TOKEN}.
- {$KUBE.STATE.ENDPOINT.NAME}
This should match the kube-state-metrics endpoint name. Check:
kubectl -n monitoring get epCommon value:
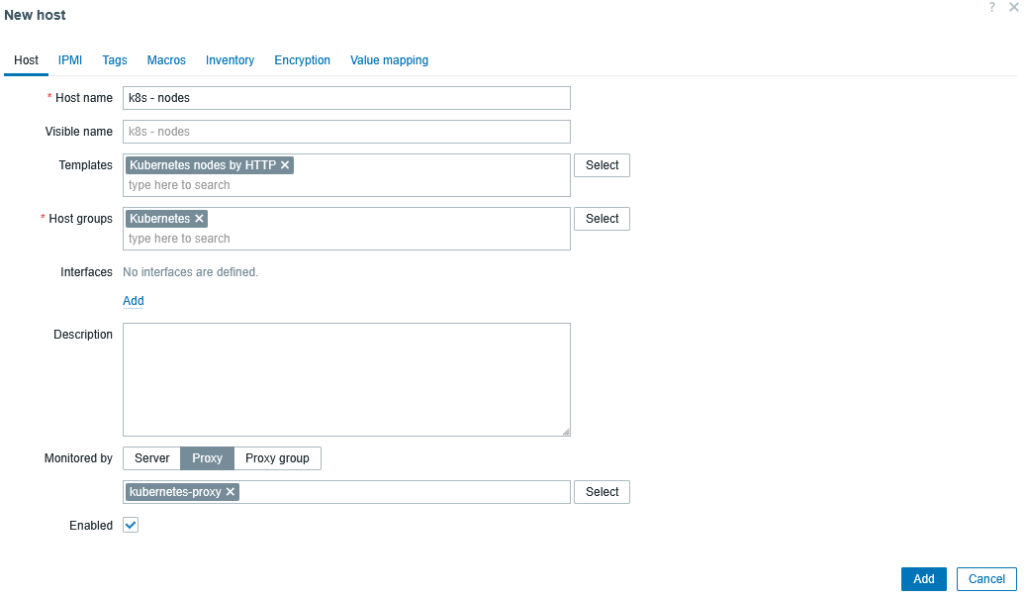
zabbix-kube-state-metrics- Zabbix UI: create Host B (Nodes)
Go to:
Data collection → Hosts → Create host
- Host name:
k8s - nodes - Host groups: e.g.
Kubernetes - Monitored by: Proxy →
kubernetes-proxy - Templates:
Kubernetes nodes by HTTP - Interfaces: none required
Save.
Configure required macros (Host macros)
Go to:
Data collection → Hosts → k8s – nodes → Macros
Set:
- {$KUBE.API.URL}
https://kubernetes.default.svc.cluster.local:443
- {$KUBE.API.TOKEN}
Use the same token as Host A.
- {$KUBE.NODES.ENDPOINT.NAME}
This should match the Zabbix Agent endpoint name (from Kubernetes Endpoints). Check:
kubectl -n monitoring get epCommon value:
zabbix-zabbix-helm-chart-agentAfter a few minutes, discovery will create per-node hosts automatically.
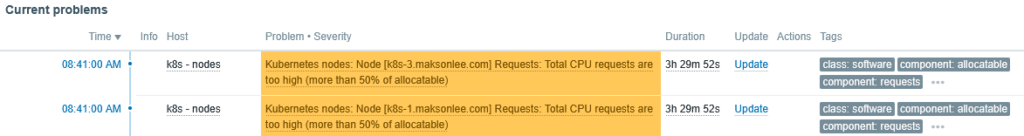
Verify alerts in Zabbix
After discovery finishes, you can see node-level triggers directly on a Zabbix dashboard via the Current problems widget.
Example
When total CPU requests exceed 50% of allocatable on some nodes, the Current problems widget shows entries like this:
Did this guide save you time?
Support this site