This quick-start example builds on our previous post about installing JupyterLab on Ubuntu 24.04, where we configured a secure, password-protected JupyterLab instance using a non-sudo user and systemd service.
Now that your JupyterLab server is up and running, let’s walk through a simple notebook to help you:
- Install Python packages inside a notebook
- Simulate temperature and humidity sensor data
- Visualize it using Matplotlib and Seaborn
- Document your analysis with Markdown cells
- Launch a New Notebook
Open your browser and visit:
http://<your-server-ip>:8888
Log in with your password. On the Launcher tab, click Python 3 under Notebook to create a new notebook.
- Install Required Packages
In the first cell, run:
import sys
!{sys.executable} -m pip install --quiet numpy pandas matplotlib seabornThis ensures packages are installed inside your virtual environment
- Import Libraries
import numpy as np
import pandas as pd
import matplotlib.pyplot as plt
import seaborn as sns- Generate Sample Data
np.random.seed(42)

data = pd.DataFrame({
    'temperature': np.random.normal(loc=25, scale=5, size=100),
    'humidity': np.random.uniform(low=40, high=80, size=100)
})

data.head()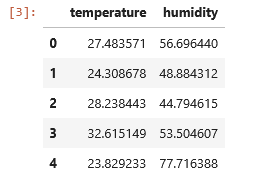
- Visualize the Data
plt.figure(figsize=(10, 5))
sns.scatterplot(x='temperature', y='humidity', data=data)
plt.title('Temperature vs. Humidity')
plt.xlabel('Temperature (°C)')
plt.ylabel('Humidity (%)')
plt.grid(True)
plt.show()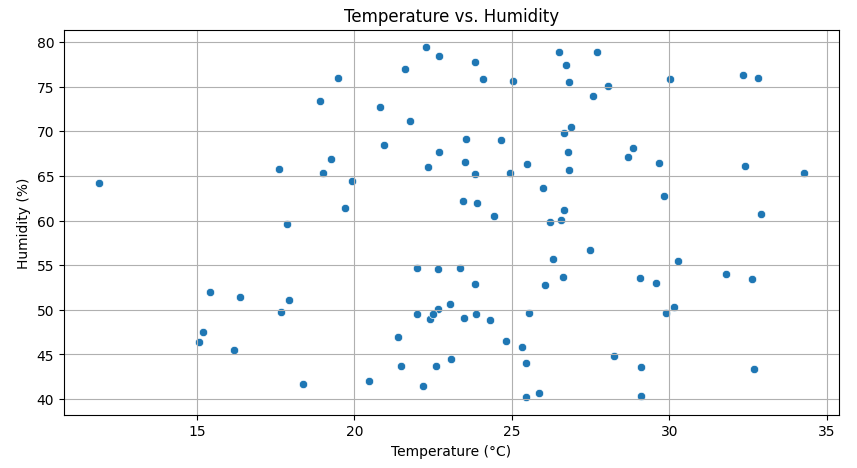
- Add Markdown Notes
Change a cell to Markdown, then paste:
# Temperature and Humidity Dataset

- Simulated using NumPy
- Visualized with Matplotlib and Seaborn
- Example for IoT, time-series, and telemetry workflows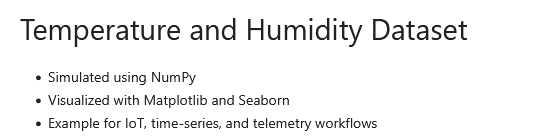
Conclusion
You’re now ready to use JupyterLab interactively:
- Install packages
- Generate and explore data
- Build notebooks with code + markdown
- Expand into IoT analytics, machine learning, or big data pipelines
Did this guide save you time?
Support this site