This post adds a Linux server (Ubuntu 24.04) as a data source to my existing OpenObserve standalone (local mode) deployment. We’ll use OpenObserve’s Data sources → Recommended → Linux integration, which installs an OpenTelemetry Collector on the server to ship:
- Host metrics (CPU, memory, disk, load, network, etc.)
- System logs (journald +
/var/log/*.log)
This post is based on
Lab context
OpenObserve (already deployed)
- OpenObserve UI:
https://openobserve.maksonlee.com/web/ - Org:
default - Ingest endpoint:
https://openobserve.maksonlee.com/api/default/ - DNS:
openobserve.maksonlee.com → 192.168.0.98
Linux server (new data source)
- OS: Ubuntu 24.04
- FQDN:
test.maksonlee.com - Hostname (journald):
test - You have sudo access
What you’ll do
- Copy the Linux install command from OpenObserve UI
- Run it on
test.maksonlee.com - Verify the
otel-collectorservice - Verify ingestion by querying journald logs for
test - Import a Linux hostmetrics dashboard to demo charts
- Copy the Linux install command from OpenObserve UI
In OpenObserve:
- Go to Data sources
- Select Recommended
- Click Linux
- Copy the installation command shown at the top
It looks like this (token redacted):
curl -O https://raw.githubusercontent.com/openobserve/agents/main/linux/install.sh \
&& chmod +x install.sh \
&& sudo ./install.sh https://openobserve.maksonlee.com/api/default/ <AUTH_KEY>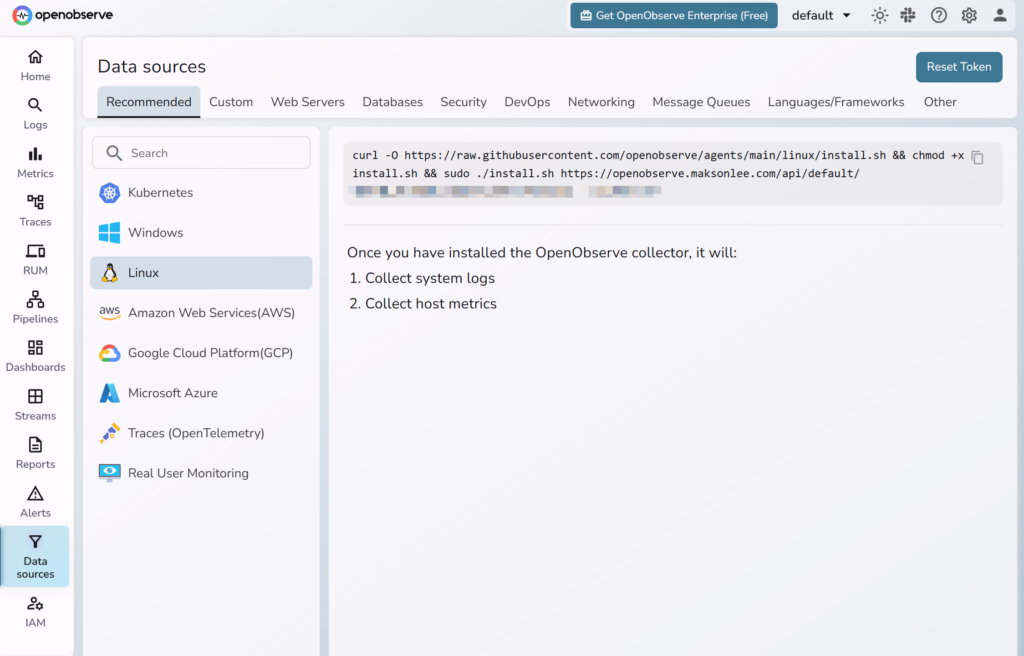
- Install the Linux collector on
test.maksonlee.com
SSH into test.maksonlee.com and run the exact command you copied from the UI.
After installation, the script typically:
- installs
otelcol-contrib - writes config to
/etc/otel-config.yaml - creates a systemd service named
otel-collector
- Verify the collector service
systemctl status otel-collector --no-pager
journalctl -u otel-collector -fIf auth/TLS is wrong, exporter errors will show up here.
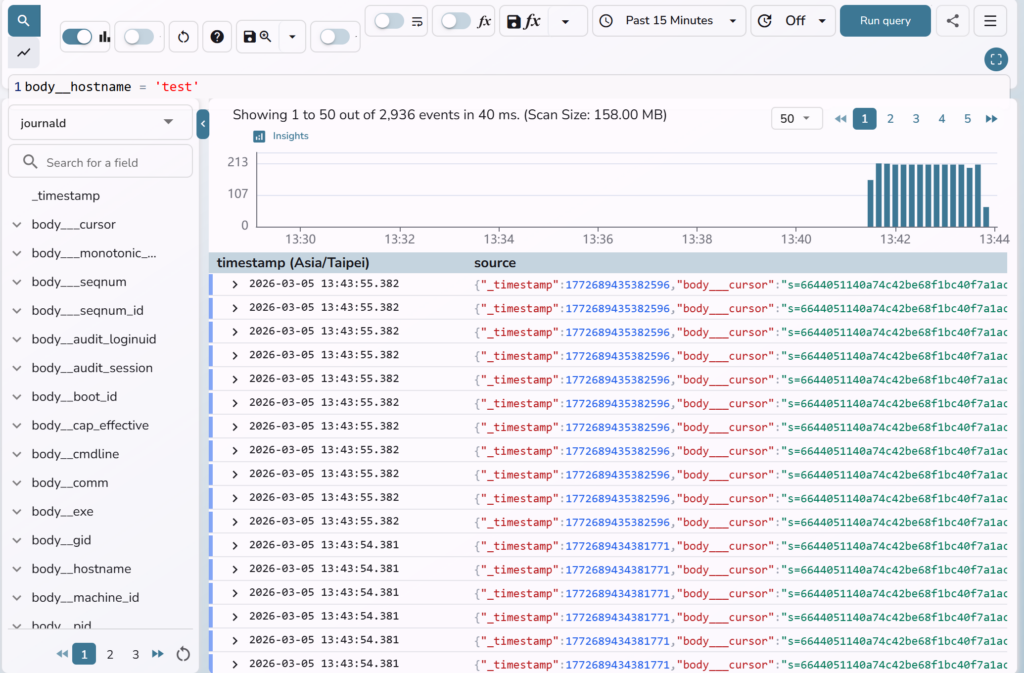
- Verify
testis ingesting (query journald logs)
In OpenObserve UI:
- Go to Logs
- Stream: journald
- Query:
body__hostname = 'test'You should see events where the latest _timestamp is recent (keeps moving forward).
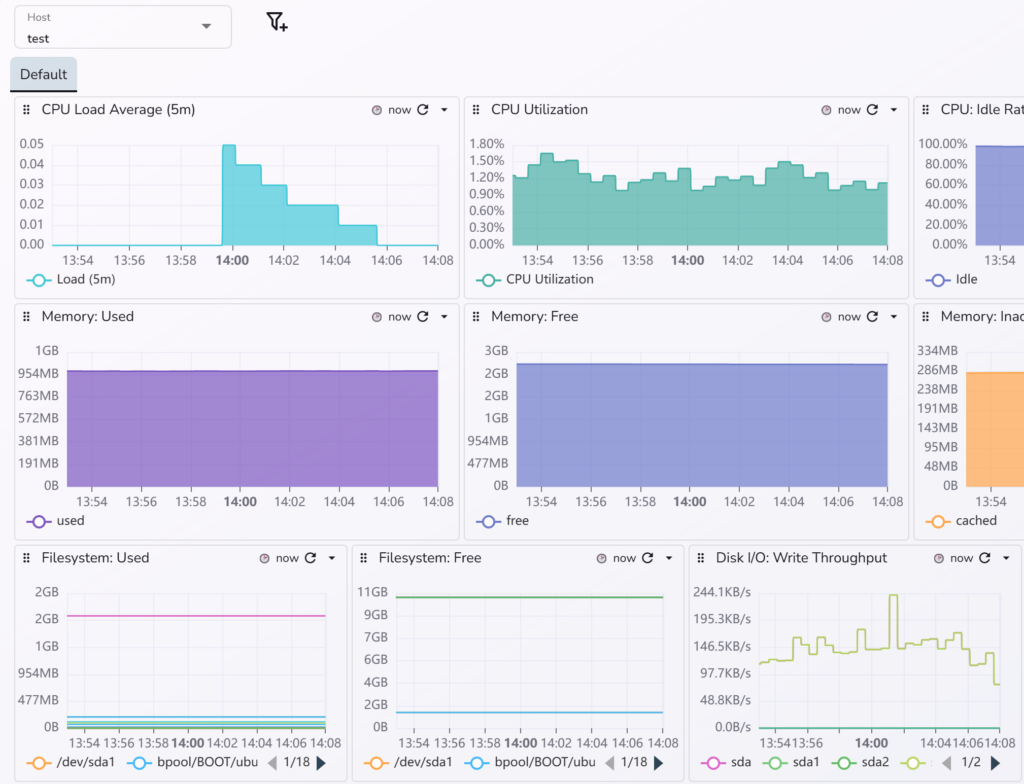
- Import a Linux hostmetrics dashboard (demo charts)
Once logs are confirmed, import a dashboard to validate metrics panels.
- Go to Dashboards
- Click Import
- Import from URL:
https://raw.githubusercontent.com/maksonlee/dashboards/refs/heads/main/hostmetrics/Host%20Metrics%20(Linux).dashboard.jsonIf the dashboard has a host dropdown, select test (or whatever value appears based on what the agent reports).
Did this guide save you time?
Support this site