What you’ll do: add a Linux machine to Zabbix using the standard agent so you get CPU, memory, disk, filesystem, and network metrics within minutes. This guide targets a trusted LAN (no TLS) and uses DNS names throughout for clarity.
Reference: If you haven’t set up Zabbix yet, start here: Install Zabbix on Ubuntu 24.04
At a Glance
- Agent host:
thingsboard.maksonlee.com - Zabbix server:
zabbix.maksonlee.com(adjust if different) - Ports: Passive 10050 (server → host), Active 10051 (host → server)
- Template: Linux by Zabbix agent
- TLS: Off (trusted LAN)
- Install Zabbix agent on
thingsboard.maksonlee.com
wget https://repo.zabbix.com/zabbix/7.4/release/ubuntu/pool/main/z/zabbix-release/zabbix-release_latest_7.4+ubuntu24.04_all.deb
sudo dpkg -i zabbix-release_latest_7.4+ubuntu24.04_all.deb
sudo apt update
sudo apt install -y zabbix-agent2- Configure the agent
Edit /etc/zabbix/zabbix_agent2.conf:
Server=zabbix.maksonlee.com
ServerActive=zabbix.maksonlee.com
Hostname=thingsboard.maksonlee.comStart/enable:
sudo systemctl enable --now zabbix-agent2
sudo systemctl status zabbix-agent2 --no-pager
# Optional live logs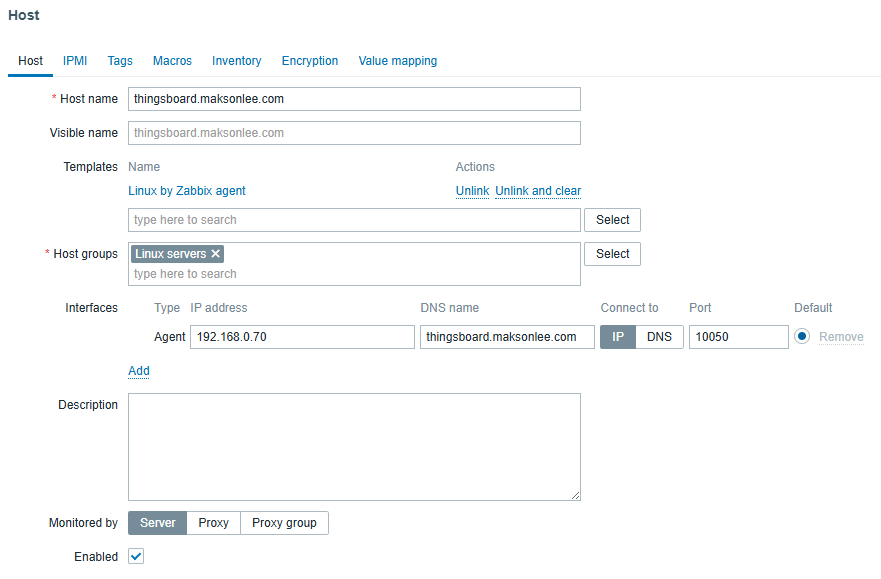
journalctl -u zabbix-agent2 -f- Create the host in the Zabbix UI
Data collection → Hosts → Create host
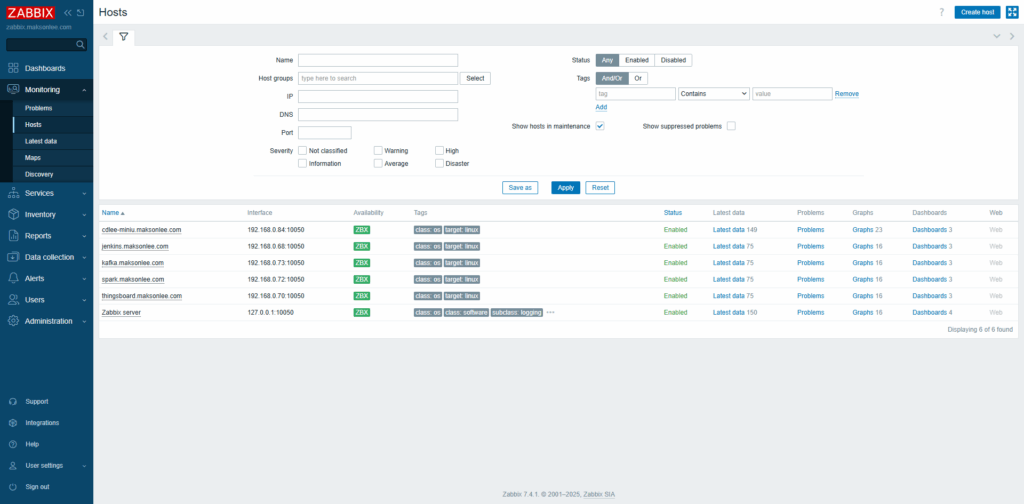
- Quick verification
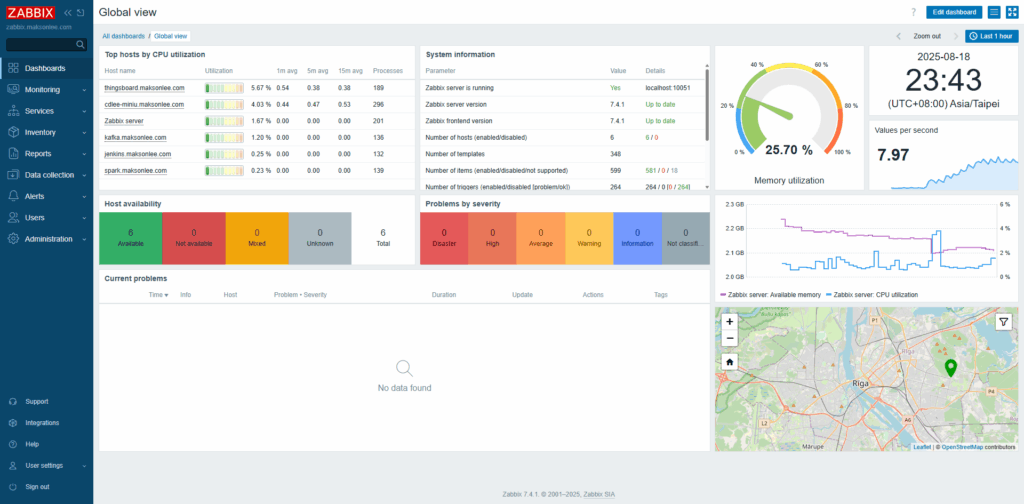
In the UI: Monitoring → Hosts. Within ~1–2 minutes you should see green ZBX and data under Latest data / Graphs (CPU, memory, disk, filesystems, network).
Did this guide save you time?
Support this site